~/posts
Wiring swamp's Traces Into My Own LGTM Stack
swamp emits OTLP traces and logs natively. This is how I ship the traces through a Caddy auth gateway into Tempo and turn them into a RED dashboard I actually look at.
This one is mostly a how-to. If you are running swamp and already have somewhere to put OpenTelemetry traces, this is how I have mine wired into the LGTM stack at home. I will try to keep the editorializing under control, but I make no promises.
Two things are worth establishing up front. swamp emits OTel traces and structured logs natively, both straight out of Deno’s telemetry runtime; this post is about the traces, which go out to an ingest gateway and into Tempo, and that is where the dashboard payoff is. The logs ride a separate OTLP signal that I point at a local Alloy, which forwards them to Loki, and I will mention that once more and then leave it alone. The second thing is that these are traces of swamp execution. They are not LLM traces, agent traces, token accounting, prompt telemetry, or any of the other things now living under the increasingly enormous “AI observability” umbrella, and that distinction matters more than it might sound.
What swamp actually emits
Every swamp run produces a span tree. The run itself is the root span, the phases underneath it are child spans, and if a step blows up, its span gets an ERROR status and the exception is recorded as an event on it. That is basically the whole shape of the thing. The runtime does not emit metrics directly; those get derived from the spans later, which is the last section of this post. What you get out of a run is a reasonably boring OpenTelemetry trace describing what it did, and boring is exactly what I want here.
It is worth being precise about this, because the words “swamp,” “agent,” and “OpenTelemetry” are now close enough together to accidentally imply a much more exciting system than the one I am describing. These are execution spans. A trace tells me that this run started here, these phases happened underneath it, this one took four seconds, and this one threw an exception. They are not gen_ai.* spans, and they do not tell me what a model prompted, completed, thought about, or spent in tokens, because there may not be a language model involved in the run at all. swamp is executing code against APIs. So when I say I trace my swamp runs, what I mean is that when the nightly workflow takes twice as long as normal or dies halfway through, I can open the trace and see which part did it. Much less sexy, and much more useful to me.
The traced wrapper
swamp speaks OTLP, so the most basic version of this is just setting the usual OTel environment variables and running it. I could put all of that in a systemd unit, but I do not, partly because I would rather not have the ingest credential sitting in a unit file, and partly because I do not want three slightly different copies of the exporter config depending on whether I launched swamp from systemd, cron, or my shell. So I have a wrapper instead.
swamp-traced.sh pulls the ingest token from pass, forces the exporter to use OTLP over HTTP/protobuf, points it at my gateway, sets the resource attributes I care about, and then execs whatever swamp command I gave it.
#!/usr/bin/env bash
# swamp-traced.sh -- run any `swamp` command with OTel traces shipped to a Tempo
# behind an auth gateway. swamp also emits structured logs on a separate OTLP
# signal, pointed at a local collector rather than the remote gateway.
set -euo pipefail

OBS_TENANT="${OBS_TENANT:-<your-tenant>}"
OBS_ENDPOINT="${OBS_ENDPOINT:-https://<your-ingest-host>}"
OBS_SITE="${OBS_SITE:-<your-site>}"

# Pull the ingest token from pass at invocation time (never written to a unit file).
TOKEN="$(pass show "otel/${OBS_TENANT}/push-token" | head -1)"

# Traces -> remote gateway. Force OTLP over HTTP/protobuf: the gateway only
# authenticates OTLP/HTTP, so its gRPC receiver must not be used here.
export OTEL_TRACES_EXPORTER=otlp
export OTEL_EXPORTER_OTLP_PROTOCOL=http/protobuf
export OTEL_EXPORTER_OTLP_ENDPOINT="$OBS_ENDPOINT"
export OTEL_EXPORTER_OTLP_HEADERS="Authorization=Basic $(printf '%s:%s' "$OBS_TENANT" "$TOKEN" | base64 -w0)"

# service.name stays plain; site/host ride on the resource so dashboards can
# filter on resource.site.
export OTEL_SERVICE_NAME="${OTEL_SERVICE_NAME:-swamp}"
export OTEL_RESOURCE_ATTRIBUTES="site=${OBS_SITE},host=$(hostname -s)"

# Logs -> a local collector on loopback (authless), not the remote gateway.
export OTEL_LOGS_EXPORTER=otlp
export OTEL_EXPORTER_OTLP_LOGS_ENDPOINT="http://127.0.0.1:4318/v1/logs"
export OTEL_EXPORTER_OTLP_LOGS_PROTOCOL=http/protobuf
export OTEL_EXPORTER_OTLP_LOGS_HEADERS=""

# `command` bypasses any `swamp` shell alias so we exec the real binary.
exec command swamp "$@"
The wrapper stays deliberately boring. Running swamp-traced workflow run ... behaves exactly like swamp workflow run ..., except that one of them leaves traces behind, because the wrapper sets up the environment and then gets out of the way. It also means I keep exactly one copy of the exporter configuration, the credential comes out of pass at invocation time rather than being copied into a unit or environment file, and the same path works whether the caller is me, cron, or systemd. I have enough configuration drift already without inventing artisanal exporter drift on top of it.
The auth gateway
My exporters do not talk directly to Tempo. They talk to <your-ingest-host>, which is Caddy, and Caddy authenticates the request and then injects X-Scope-OrgID before proxying it onward to Tempo.
<your-ingest-host> {
	@traces path /v1/traces*
	handle @traces {
		basic_auth {
			# hash with: caddy hash-password
			<your-tenant> <bcrypt-hash-of-push-token>
		}
		reverse_proxy tempo:4318 {
			header_up X-Scope-OrgID <your-tenant>
		}
	}
}
That second part is the one that matters. Tempo uses X-Scope-OrgID as the tenant identifier: the header decides which tenant a write lands in and which tenant a query reads from. It is tempting to set that header on the OTel exporter, because that is where most of the examples show you how to add arbitrary headers, but I specifically do not, because if the client supplies X-Scope-OrgID then the client is effectively allowed to tell Tempo which tenant it is. At that point my tenant boundary depends on every client being honest and correctly configured, which is not much of a boundary. Instead, the exporter proves who it is to Caddy, Caddy maps that credential to the tenant and writes X-Scope-OrgID itself, and the sender never gets to choose. That is most of the cleverness in this setup, such as it is: authentication happens at the edge, and the trusted edge is what turns identity into tenancy.
Attributing spans to a host and site
Once I had traces flowing, I ran into the next obvious problem: a trace showing that some swamp run happened becomes a lot less interesting once swamp runs in more than one place. OpenTelemetry already has an answer for this in resource attributes, and swamp reads OTEL_RESOURCE_ATTRIBUTES, so my wrapper stamps each trace with the site and hostname:
export OTEL_RESOURCE_ATTRIBUTES="site=<your-site>,host=$(hostname -s)"
Now the spans arriving in Tempo carry the site and host they came from. This did not work the first time, and for once that was actually not because I had typoed something: swamp was reading the resource attributes but not threading them all the way through to the exported spans, so everything arrived in Tempo unattributed. That got fixed upstream in swamp-club#1084, and after that, host and site attribution started showing up where they were supposed to. I would love to say I diagnosed it immediately from first principles, but mostly I stared at two implementations of what I thought was the same thing until it became obvious that one of them was quietly dropping data. Observability.
From traces to a dashboard I actually look at
A raw trace is excellent when the question is why a particular run did something stupid, and much less useful when the question is whether swamp has been doing something stupid all week. I am not going to periodically scroll through a trace list looking for vibes, so I let Tempo’s span-metrics machinery derive metrics from the incoming spans, in particular the useful, boring RED trio of rate, errors, and duration. Those metrics land in the metrics store, and Grafana gets panels pointed at them.
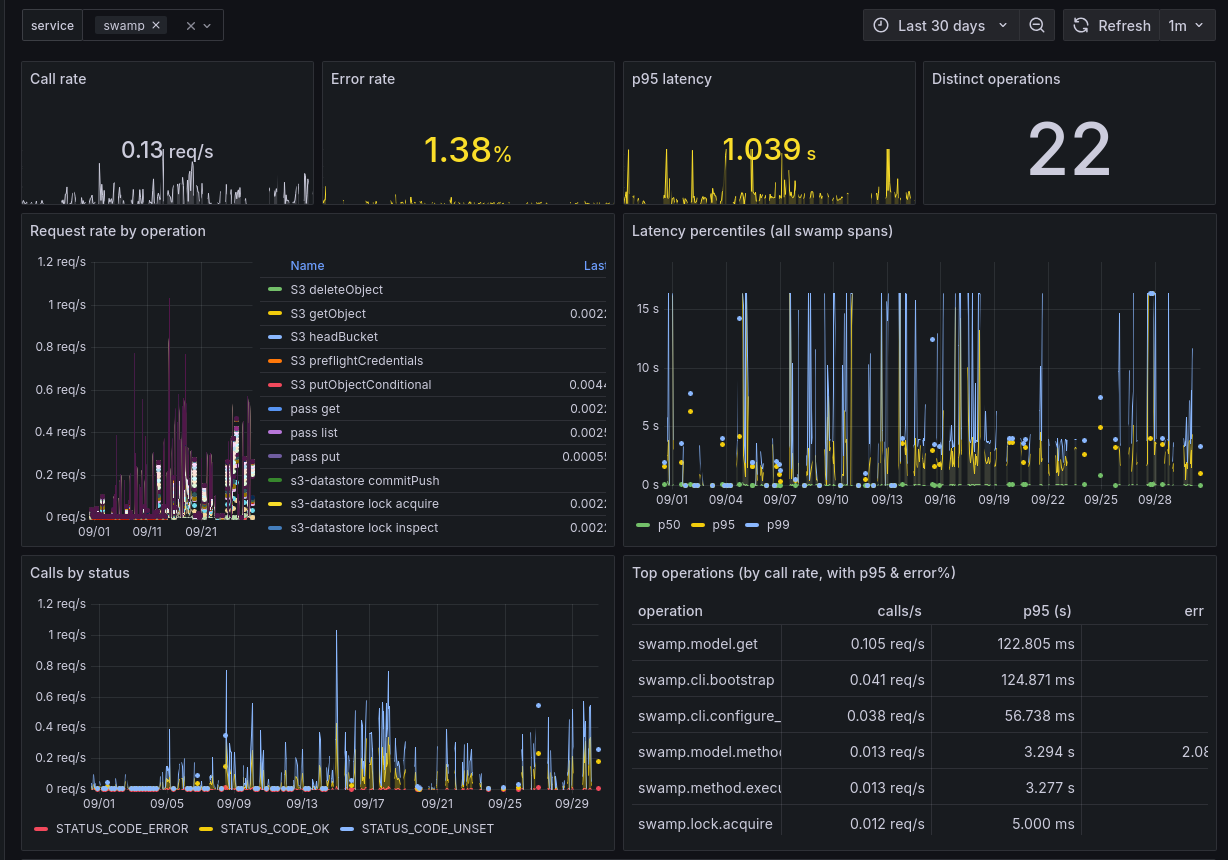
That gives me the view I want most of the time: how often runs are happening, how many are failing, how long they take, and whether any of that is drifting. If everything looks normal, I do not care about the individual traces; if one of the graphs starts doing something exciting, then I click through to the trace and read the span tree to figure out which phase went sideways. Metrics tell me something is weird, and traces tell me why. It is hardly a novel observability strategy, but it fits swamp nicely because a run already maps cleanly onto a trace tree.
So, the plumbing
The full path is not complicated. The wrapper constructs the OTel environment and fetches the credential from pass, Caddy authenticates the exporter and assigns the Tempo tenant, Tempo stores the span trees, and the span-metrics generator turns those traces into enough RED metrics to make a useful Grafana view. The only especially swamp-specific pieces are that swamp emits the execution traces natively and that I want enough resource attributes on them to know where they came from; everything after that is just ordinary OTel plumbing, which is frankly how I prefer my observability plumbing.
The other half of this is watching the LGTM stack that watches all of the other things, because eventually every monitoring system becomes somebody else’s monitoring problem. That is its own can of worms, and its own post. This one was just the pipes.